

We know that STAR provides excellent information for a teacher regarding their students’ and classes’ particular strengths and weaknesses and suggestions as to what are the next instructional steps to take on both levels. However, a question pops up at times regarding whether the instructional directions implied by an analysis of STAR results will optimally benefit the student and school in terms of the all-important state test results.
We have analyzed the relationship between STAR and each of the state test results and found that the relationship approaches that which would be expected between the state test and itself. We conclude that the statement “optimizing scores on STAR will result optimizing scores on the state test” is true.
However, this has been a theoretical -trust me- statement that opens itself to doubt by some who would like to concentrate on other issues. Frustratingly, it has not been possible to directly analyze the relationship between a state test given twice to a set of students and compare it with the relationship between STAR and that state test administered to those same students. Basically, we have not been able to give the state test twice to a set of students.
The State of Florida has solved that problem for us by copying our progress monitoring approach. They administer the same test three times a year (they call it PM1, PM2 and PM3) with the last assessment serving as the “state test” for accountability purposes. Florida has established STAR as the state test for grades K – 2 and Cambium as the state test for 3 – 8.
We want to evaluate the relationship between STAR and the second administration of the Cambium test and compare it to the relationship between the first administration and the second administration of the Cambium test. If these relationships are very close to each other, we can conclude that the statement “optimizing scores on STAR will result optimizing scores on the state test” is an established fact rather than merely a theoretical fact. Practically, this result will mean that utilizing the resources of STAR is an optimal tool to utilize in educating our students as well as doing as well as possible on the state test.
Here is a visual designed to compare these relationships within grade 4 students in Mathematics.
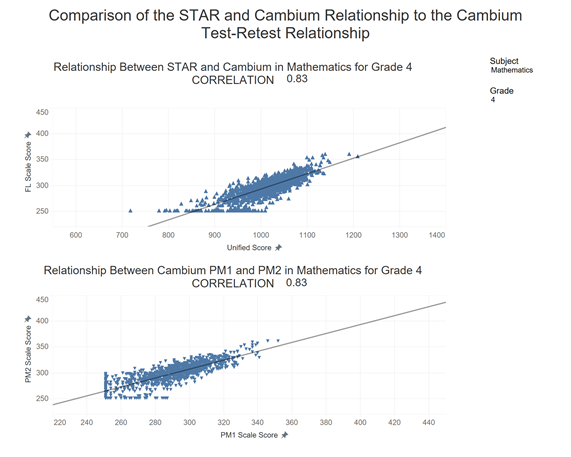
In this case, as well as some others, the correlations are identical. The difference in correlation coefficients does not exceed .04 for any subject/grade level, indicating that STAR is, indeed, an appropriate stand-in for the state test and that optimizing scores on STAR will optimize scores on the state test.
Please note that there is a straight line of dots at the low end of the PM1 and PM2 axes representing a floor (lowest reportable value) for the state test. This tells us that the state test provides little useful information for students well below grade level.
For states other than Florida, there is a bit of a logical leap necessary to establish the truth of our statement “optimizing scores on STAR will result optimizing scores on the state test”. Considering that the state test to STAR test relationships found in the other states are similar to both the state test to STAR and state test to itself relationships established in Florida, this is a very short leap.
This workbook is available in Tableau in the C. Research project. If you do not have access, please ask someone on your campus who has, and I suspect that they will be happy to show it to you.
I would be remiss if I did not further discuss the dangers of concentrating exclusively on the requirements of the state tests. State tests are based solely on the state grade level standards. These are statements of specific competencies expected of typical students at the end of the year within a particular state and grade level. These standards can be viewed as the products, or outcomes, expected at each grade level within a state. These standards reflect minimal expectations for proficiency and should not be seen as a limit to a student’s growth.
These standards represent expectations for the typical student that is on grade level. As such, they provide excellent curricular guidance for these students (read quartile 2 and quartile 3 students) but not so much for quartile 1 and 4 students. Additionally, they do not provide information useful for prioritizing a teacher’s focus or determining the reasons for a lack of mastery. State tests and other assessments based exclusively on the state grade level standards fail to provide guidance for the education of students at either end of the distribution. STAR will provide the exact position of every student in their educational journey, regardless of whether they are at, below, or above grade level expectations.
Skills represent the intellectual abilities necessary to achieve competence in a subject. They have been drawn from research on the process and progression of knowledge acquisition. They form the basis of the learning progressions utilized by Renaissance to make instructional recommendations. As such, they can provide information for all students including those that are either not ready for the grade level standards or are able to progress beyond them. See the Skills workbook in Tableau.
A final caveat. Be careful in utilizing the screening categories developed by Imagine to compare to the classifications provided by the state test. Since each state sets its own definition of “Proficient”, these classifications may be very different in some states. Renaissance provides predictions of a student’s performance on the state test based on an analysis of the relationships within that state. Predictions on the student level will inevitably be prone to increased error due to variation in both the criterion and the predictor but they should be strong on the school level. The Prediction workbook should be helpful in this regard.