
As part of the steadfast support that we provide our family of 55 campuses across the country, the Imagine Schools National Organization partners with various groups to provide our schools with proven solutions that accelerate student learning. One such partnership is with Renaissance and STAR Assessments.
Since 2014, Renaissance has provided our teachers with the critical data needed to assess student learning, inform instruction, and ensure equity and access for all our learners. Renaissance provides a large variety of reports that give us great insight into the current status and progress of our students.
Many of these reports use red/green (sometimes with other colors) to provide a quick visualization of a student’s status. There can be some confusion when these colors appear to disagree within a single testing window. Let’s look at some of the possible causes.
Testing conditions:
We have learned from our studies on remote testing conducted in Spring 2020 that, for most students, the results of remote testing are reliable and can be used to drive instructional decisions. However, we also discovered that there are slightly more extreme scores (scores far from what we know about the student’s ability). This phenomenon occurs more frequently in the primary grades. Extreme scores can be caused by many factors from poor testing conditions, to a parent’s desire to assist their children. For this reason, test results should be reviewed as soon as a student completes the assessment in order to identify outliers. These are scores well out of the expected range for an individual student. For an example, a struggling student whose score is a PR of 95 or an advanced student’s whose PR is 15 would be consider outliers. These outliers are easy to identify since they tend to be FAR off. These scores should be invalidated (contact the assessment team) and the student re-tested within the screening window. Perhaps a diplomatic conversation with parents or caregivers might be in order.
Colors mean different things on different reports:
For this section, I will use the example of a fictitious student, Danny, a first grade student who took the STAR Reading test three times during the Fall window. The scores were, in order, PR = 99, PR = 56, PR = 1.
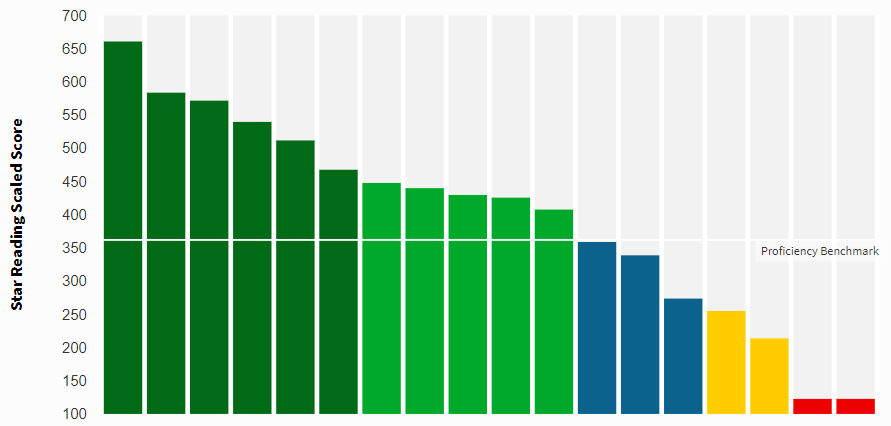
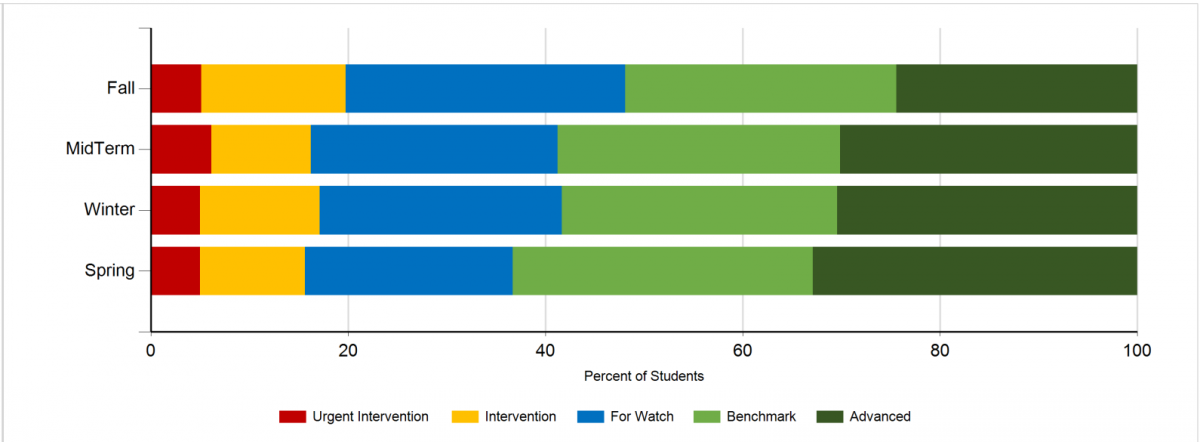
The Screening Report, as well as growth reports referencing particular screening window(s) will use the first assessment in the Fall window and the last assessment in Mid, Winter and Spring. The screening report utilizes our screening categories where a PR>= 75 is Advanced and colored dark green. Danny will be in the dark green section on this report. The scale used is a standardized scale where a PR of 95 indicates that Danny (or whoever actually took the assessment) scored better than 95% of first graders nationally taking the test in the Fall.
Mastery Reports use a different scale entirely. A student who has achieved mastery (beyond proficiency) on a particular skill is expected to answer 85% or more of the questions correctly on a test focused on this skill. This does not relate at all to standardized scores and only looks at Danny’s mastery of this particular skill. This report uses the current (latest) score and would have picked up the last one. Danny was solidly red on this report.
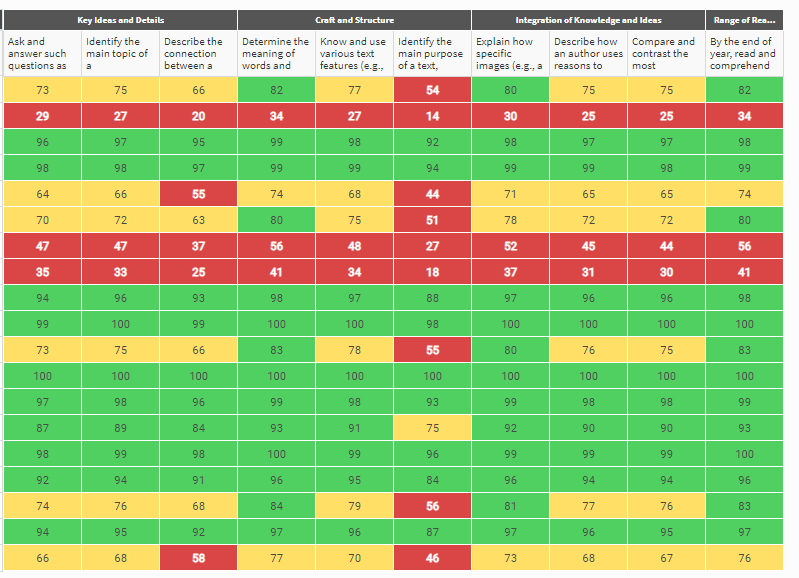
State Standards Reports attempt to predict the performance of the student on the state test to be administered in the Spring based on the linkage studies conducted by Renaissance. We know that there is a strong correlation between the STAR results and the state assessment results and maximizing STAR scores will result in maximizing the state assessment results. That said, prediction on an individual student level contains a lot of variance, and predictions between Fall and Spring will be less accurate than between Spring and Spring. Predicted scores should only be used on a grade level or school level to identify subgroup challenges. The state standards report also utilizes the current (most recent) score and Danny would be bright red here as well.
Note that the score that might possibly be appropriate for Danny was not used in any of these reports. This result (PR = 56) should be cross-checked against the teacher’s observation of his performance in class and the inappropriate scores should be invalidated. In almost all cases the inconsistencies observed between reports are not due to any issues in the reports themselves but on the underlying data and/or the interpretation of the report.