
Previous studies conducted on the results of the STAR spring window assessments and the various state tests have demonstrated a high and consistent relationship in all of the states in which Imagine has a presence (see my first blog post“ How Optimizing Performance on STAR Relates to State Assessments”). Therefore, the issues discussed in this blog post will be based on the results in one state for consistency and availability purposes. The conclusions drawn are applicable to any state.
Scale Scores
The scale score is the basic result of the STAR Assessment process utilizing Computer Adaptive Test (CAT) technology. The scale score indicates a student’s position on an educational continuum. The scatterplots below present the relationship between the STAR Spring assessment and the state test for Reading (on the left) and Math (on the right).
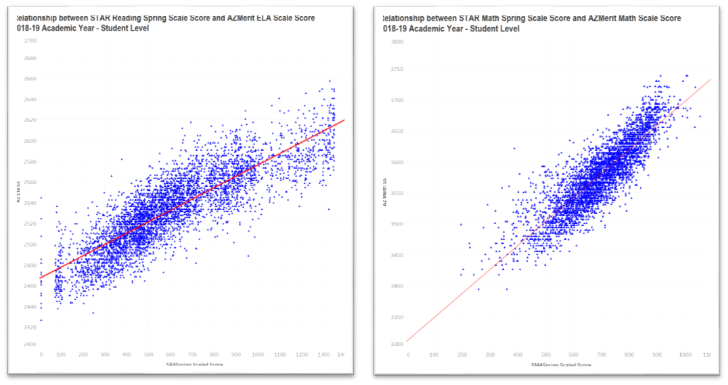
This relationship is very strong with correlation coefficients of 0.85 for Reading and 0.87 for Math. A reasonable question would be “why is there so much scatter if these tests are so good?”. The answer is that, on an individual level, psychometric measurements (e.g. these assessments) inherently carry with them a greater amount of measurement error than do physical measurements (e.g. height).
We know that when measurements are averaged over a naturally occurring group (e.g. a grade level within a school) that these random errors have a tendency to cancel each other out (one student might have a positive measurement error and another a negative measurement error). Let’s take these same scores and average them within each school/grade level combination (e.g. School A – grade 4, School A – grade 5, etc.). This will have the effect of removing much of this individual measurement error and leave those errors associated with differences between these groups (e.g. slightly different testing conditions, etc.) or between the assessments themselves.
The scatterplots below present the relationship between the STAR Spring assessment and the state test for Reading (on the left) and Math (on the right) after averaging within the school/grade-level groups.
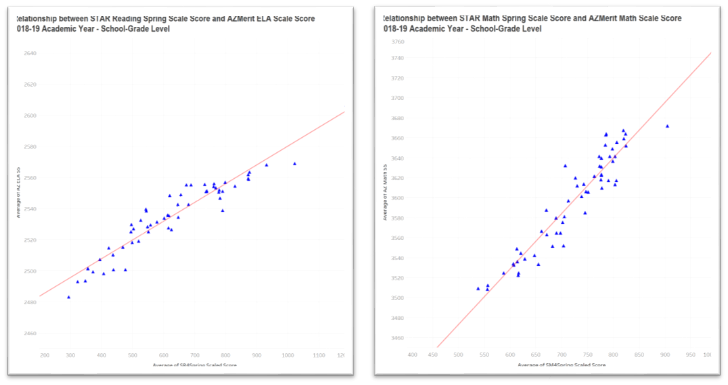
This relationship is extremely strong with correlation coefficients of 0.95 for both Reading and Math, indicating that the two different assessments have extremely similar results on a group level.
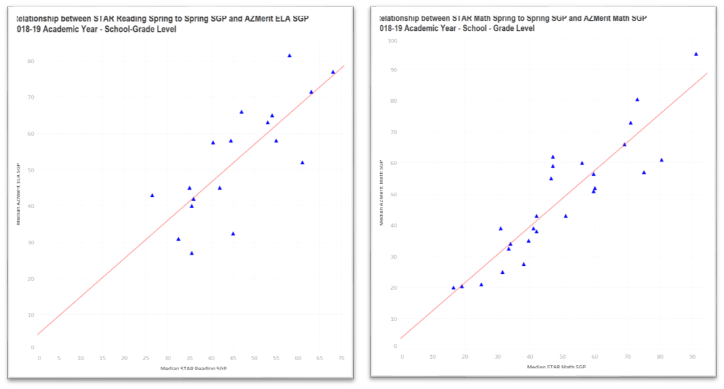
Student Growth Percentiles (SGP)
Now let’s look at the relationship between these two assessments in relationship to student growth (movement from one spot on the educational continuum to another). The scatterplots below present the relationship between the STAR Spring – Spring SGP and the state test SGP for Reading (on the left) and Math (on the right).
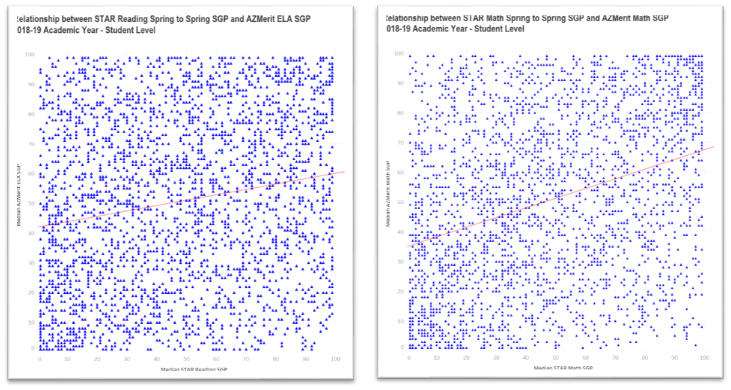
What’s going on? This relationship is very weak with correlation coefficients of 0.18 for Reading and 0.33 for Math. A reasonable question would be “why is there almost no relationship between the growth scores?”. The answer is that, again on an individual level, growth scores have approximately twice the measurement error of position scores (scale scores). This is due to the fact that there is error contained in the initial measure as well as error in the final measure. Thus, a Spring to Spring growth score has two sources of error.
Let’s apply the same approach taken earlier and determine the median SGP for each school/grade level combination for Star and the state test. This will remove a lot of this individual measurement error. However, since the individual measurement error is so large, there will be some individual error still impacting the results.
The scatterplots below present the relationship between the STAR Spring – Spring SGP and the state test SGP for Reading (on the left) and Math (on the right) after averaging within the school/grade-level groups.
That’s more like it! This relationship is very strong with correlation coefficients of 0.80 for Reading and 0.90 for Math.
Now, that was interesting and the graphs were cool. But what does this mean for me and my students?
Assessment Conclusions
- The STAR and state assessments are so closely related that STAR can be utilized as a proxy for the state test. The error associated with using STAR as a predictor is not much different than using the state test to predict itself.
- Optimizing student scores on STAR will optimize student scores on the state test
Student score utilization
- All psychometric results on an individual level have significant measurement error involved. In addition to the normal error involved with these measurements (common cause) are all of the unusual causes of error (special cause). For example, Jose was very sick the day he took the test. This special cause will have an even greater impact on the measurement result. Therefore, individual assessment results should not be utilized in isolation. They must be compared to everything else that a teacher knows about a student to provide a validity check.
Growth scores have a huge amount of normal variation (not to mention special cause) and should rarely be used on an individual student level. Their most important use is in the evaluation of educational programs, classrooms, grade levels, and schools. Their optimal use on the individual level would be to determine if students’ growth was high, typical, or low in order to begin the process of identifying potential students for either targeted support or acceleration.