Oh, my head hurts! What is the relationship between all of these different numbers representing my student’s performance on STAR (Scale Score, PR, NCE) and how are they used? Why do we complicate matters with the NCE?
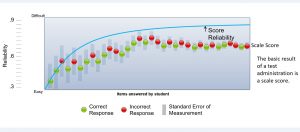
A Computer Adaptive Test (CAT), like the STAR assessments that we use, successively selects questions for the purpose of maximizing the precision of the assessment based on what is known about the examinee from previous questions. As shown in the picture below, the computer presents a more difficult question when the students gets the previous question right and an easier question when the student gets the question wrong. This results in the computer fairly quickly (within 30 questions) zeroing in on a highly reliable estimate of the “true” educational level of the student.
Click on image to expand
This estimate is the scale score. It is the basic result of the CAT assessment process. The scale score is an equal interval measure that ranges from 0 to 1400 and is independent of the grade placement of the student. The scale score functions in a similar manner in the education arena as a child’s height measured by a ruler functions in the physical realm. Both are equal interval measures (meaning that the distance from 30 to 40 units is the same as the distance from 50 to 60 units). This also means that these measurements (height, scale score) can be summarized for an appropriate group using the mean. The scale score is the basic entry point to the core progression developed by Renaissance and the instructional recommendations derived from them. A student with a scale score of 450 will have a particular set of instructional recommendations just as a child who is 36” will have a particular clothing size recommendation. These are ABSOLUTE uses of these measurement scales.
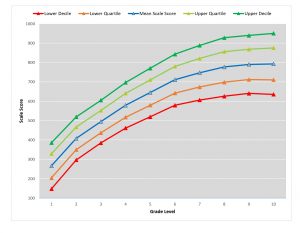
These scores are, however, useless to answer questions like “is my child at a normal height” or “is this student’s academic level what should be expected”? These are RELATIVE use of these measurement scales. Additionally, even though these are interval scales, they are not linear. As anyone that has seen a growth chart (height vs age) in a doctor’s office knows that a growth of two inches means something very different during a child’s third year than during a child’s tenth year. The chart below is a scale score growth chart, equivalent in the educational realm to the growth chart in a doctor’s office. These charts, both in the doctor’s office and the one below, are derived from an analysis of a very large sample meant to represent the population of children/students in the United States.
Click on image to expand
The blue line represents the mean or “expected” value of the scale score for each grade level. A student scoring on or near this line would be accurately described as “on grade level”. In order to add more detail to this rough comparison, the percentile rank (PR) score was developed. The PR represents the proportion of the population (or sample) of students at the same grade level who scored less than the scale score in question. The other lines on the graph represent a PR of 10 (red), 25 (orange), 50 (blue), 75 (light green), and 90 (dark green). Therefore, a scale score of 500 would represent a PR of 50 for a student with a grade level of 3 and a PR of 20 for a student with a grade level of 4. We now have a score, (PR), that means the same regardless of grade level. A PR of 75 means the student is above 75% of the population at the same grade level and below 25%. A PR of 75 means the same for a student at a grade level of 4 as it does for a student at a grade level of 9.
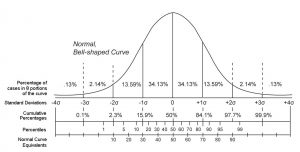
The PR, however, is not an equal interval scale and thus cannot be summarized utilizing the mean. It is also very misleading when used to indicate growth. A movement from a PR of 20 to a PR of 30 is much larger than a movement from a PR of 40 to a PR of 50. This is because test scores, as well as height values, are normally distributed. This is pictured in the graph of the normal distribution below:
The PR (percentile rank) is highlighted in blue and demonstrates a significant bunching in the middle.
Click on image to expand
In order to resolve this issue, the normal curve equivalent (NCE) was developed. It is a mathematical transformation of the PR into an equal interval scale. The NCE is highlighted in green. Both the PR and the NCE have a range of 1 to 99 and a mean of 50.
With the NCE we now have an equal interval scale that can be summarized and growth compared. The amount of growth from an NCE of 20 to an NCE of 30 is equivalent to the growth from an NCE of 40 to an NCE of 50.
This provides a measure of growth that is comparable and can be summarized across ability levels and grade levels.
Imagine Schools utilizes the NCE score to calculate learning gains because the NCE score can support these calculations and retains its meaning across grade levels and subject areas. A gain score is defined as the difference between the Fall and Spring test NCE score. That is, gain = Spring NCE – Fall NCE. This results in a score that has an expected value of 0 (when the student demonstrates the same gain as the norming population). A negative gain does not mean that a student has actually lost knowledge, just that he/she has not made similar gains as those demonstrated by his/her peers in the norming population. In order to avoid the misinterpretation of a negative gain score, a transformed learning gain value is computed:
The transformation equation is:
Learning Gain = 1 + (gain/100).
This results in a score that has an expected value of 1.0.


Comments 4
Great and descriptive post to help us all have a clear understanding of the STAR scores. This will serve as a good reference point for all teachers.
I find your analogies to be very helpful in understanding the use of these numbers. “A student with a scale score of 450 will have a particular set of instructional recommendations just as a child who is 36” will have a particular clothing size recommendation.”
The explanation of the NCE and how it has created an equal interval scale s quite helpful. It is one of those things that I am sure I have heard numerous times but this issue connected the dots for me. The explanation of the equivalency in NCE growth of 20-30 and 40-50 was helpful. Great BLOG! Thanks!
This information will allow me to further develop a clear understanding of STAR and the integral parts of it. Thank you.